
Lead Generation Metrics That Actually Drive Pipeline

Generating more leads is a common directive, but that advice is incomplete, and often expensive. A larger lead count can hide weak qualification, slow follow-up, shallow account engagement, and a sales pipeline that isn't moving. The dashboards look busy while the forecast loses credibility.
The useful question isn't “How many leads did marketing create?” It's “How quickly did qualified buying activity become pipeline?” The answer lives in MQL-to-SQL conversion, pipeline velocity, CAC payback, buying-group depth, and reply quality. These lead generation metrics give RevOps leaders operational levers instead of decorative charts.
Table of Contents
The Lead Volume Trap and Why It Hurts
Lead volume is easy to report and hard to defend. It fits neatly into a weekly recap, rises after a broad campaign, and gives everyone a number to celebrate. But volume alone doesn't tell you whether sales accepted the contacts, whether the right accounts engaged, or whether opportunities progressed.
A company can add contacts while creating three problems at once:
Rep waste: Salespeople spend time sorting invalid, poorly matched, or low-intent contacts.
Budget leakage: Marketing funds channels that produce forms but not sales-qualified opportunities.
Forecast distortion: Leaders model future revenue on a top-of-funnel number that loses most of its value before sales engagement.
The foundational benchmark makes the gap visible. In February 2025, the median B2B website visitor-to-lead conversion rate was 2.3%, while top-quartile programs reached 4.7% or higher, according to Callbox's B2B lead generation benchmark. At 100,000 qualified monthly visits, that difference represents about 2,300 leads at the median versus 4,700 or more at top-quartile performance.
That still doesn't prove pipeline quality. Salesforce's State of Sales 2024 benchmark reports that only 13% of MQLs convert to sales-qualified opportunities across B2B SaaS, based on a survey of 5,500 sales professionals across 27 countries. The same benchmark set reports a 17-month median CAC payback period in SaaS, linking poor conversion to a longer wait for acquisition costs to recover. See the benchmark discussion at The Starr Conspiracy.
Practical rule: Keep lead volume on the dashboard, but never let it outrank the rate and speed at which leads become accepted pipeline.
Defining MQL, SQL, and the Stage Handoff
A clean funnel needs shared definitions. Without them, marketing celebrates an MQL that sales considers unworkable, while sales blames lead quality for a scoring model nobody has audited.
Four stages with four observable triggers
An MQL, or marketing-qualified lead, is a contact that fits the ideal customer profile and has shown meaningful buying intent. A pricing-page visit, a demo request, or a content download tied to an active buying window can qualify, but the exact rule belongs in the CRM and must be visible to both teams.
An SQL, or sales-qualified lead, is an MQL that sales has accepted after a qualifying action, such as an SDR screen or discovery call. Acceptance isn't a courtesy status. It should require documented criteria, an owner, and a timestamp.
An opportunity is an SQL with a confirmed business need, authority, timeline, and budget. Teams may use BANT or MEDDIC, but the framework matters less than consistent evidence in the record. Closed-won means the contract has been executed, not that a rep feels optimistic about the deal.
Stage | Qualifying Action | Owning Team | CRM Fields Required |
|---|---|---|---|
MQL | Form submission or intent threshold reached | Marketing | ICP fit, source, intent event, timestamp |
SQL | Sales acceptance after SDR screen or discovery | Sales | Owner, acceptance status, qualification notes, next step |
Opportunity | Need, authority, timeline, and budget confirmed | Sales | Amount, close date, stakeholders, stage, qualification framework |
Closed-won | Contract execution | Revenue and finance | Contract date, booked revenue, product, account, attribution |
RevOps should audit every transition. If an MQL has no intent event, an SQL has no acceptance evidence, or an opportunity has no next step, the stage is probably aspirational rather than operational. Teams refining these criteria can use this guide to qualifying sales leads as a practical reference point.
The Core Lead Generation Metrics at a Glance
A useful dashboard connects each number to a decision. MQL volume tells you whether marketing is creating potential demand, but MQL-to-SQL conversion tells you whether sales agrees that demand is real. SQL-to-opportunity rate then tests whether accepted leads contain enough commercial substance to enter an active deal cycle.
Some formulas are universal. Benchmarks aren't. Use the table as an operating reference, then segment by channel, market, deal size, and motion rather than forcing every source into one blended average.
Metric | Formula | Healthy Benchmark | Diagnostic Question |
|---|---|---|---|
MQL volume | Count of MQLs in a period | Track trend and source mix qualitatively | Are we attracting enough ICP-fit demand? |
MQL-to-SQL conversion | SQLs ÷ MQLs × 100 | 13% benchmark across B2B SaaS; healthy programs may range from 13% to 25% | Does sales accept what marketing sends? |
SQL-to-opportunity rate | Opportunities ÷ SQLs × 100 | Use a consistent internal baseline | Do accepted leads have a verified commercial problem? |
Pipeline velocity | Opportunities × average deal size × win rate ÷ sales-cycle length in days | Compare directionally against prior cohorts | Is qualified pipeline becoming revenue faster? |
CAC | Fully loaded sales and marketing cost ÷ new customers | No universal range, segment by motion | What does each new customer actually cost? |
LTV-to-CAC ratio | Customer lifetime value ÷ CAC | Compare with payback and margin, not in isolation | Can growth support itself? |
Reply rate | Replies ÷ delivered outbound messages × 100 | 1% to 3% average, 5% to 8% top quartile, and above 10% top decile in one independent B2B roundup | Does the message create a real conversation? |
The 13% MQL-to-SQL benchmark comes from the earlier Salesforce-based benchmark source. The reply-rate thresholds come from Bowen AI Strategy Group's 2026 B2B benchmark roundup.
The lever matters more than the label. If MQL-to-SQL falls, tighten scoring and inspect source quality. If velocity stalls, remove unnecessary approval steps, improve routing, or address deal-stage friction. A fuller funnel view is available in this B2B lead generation funnel guide.
Cost, Payback, and Lifetime Value Math
Finance-friendly lead generation metrics start with definitions that survive scrutiny. Fully loaded CAC includes advertising, sales and marketing salaries, software, data, events, and content production. Dividing ad spend by customers may be useful for campaign analysis, but it isn't the cost of acquiring a customer.
Use these formulas:
CAC: Total sales and marketing acquisition cost ÷ new customers.
LTV: Average revenue per account × gross margin ÷ customer churn rate.
LTV-to-CAC: LTV ÷ CAC.
CAC payback period: CAC ÷ monthly gross-profit contribution per customer.
The LTV calculation needs disciplined assumptions. If churn is understated or gross margin is ignored, LTV becomes a flattering fiction. Payback adds the cash-flow perspective, showing how long the business funds acquisition before recovering the cost.
The requested illustrative SaaS math, $1,200 CAC and $8,400 LTV, produces a 7:1 LTV-to-CAC ratio. A 14-month payback period can still create cash pressure even when the ratio looks attractive. For context, the cited SaaS benchmark reports a 17-month median CAC payback period, so payback deserves its own board-level line rather than being buried inside a ratio. The benchmark is discussed in this B2B lead generation benchmark analysis.
Metric | Formula | Example | Healthy Range | Primary Lever |
|---|---|---|---|---|
CAC | Fully loaded acquisition cost ÷ customers | $1,200 | Segment-specific | Tighten channel mix |
LTV | Revenue × gross margin ÷ churn | $8,400 | Segment-specific | Expand accounts and retain customers |
LTV-to-CAC | LTV ÷ CAC | 7:1 | Interpret with payback | Improve value or reduce acquisition cost |
CAC payback | CAC ÷ monthly gross-profit contribution | 14 months | Compare with cash plan | Accelerate sales cycle and onboarding |
Don't blame marketing automatically when CAC rises. A slow sales cycle, weak routing, or repeated late-stage slippage can keep acquisition costs unrecovered even when the original source is sound. Use cost per acquisition guidance to separate channel efficiency from the broader cost of winning customers.
Reading LinkedIn and Social Selling Signals
A LinkedIn dashboard can make a rep look busy without showing whether buyers care. Profile views and connection acceptances indicate attention, but they don't carry the same intent as a thoughtful reply or a booked meeting.
Consider a rep working a target pool of 80 mid-market operations leaders during a week. The supplied funnel visualization shows 45 profile views, 32 connection acceptances, 18 content engagements, and 7 direct-message replies. Those figures describe the scenario, not a universal benchmark.
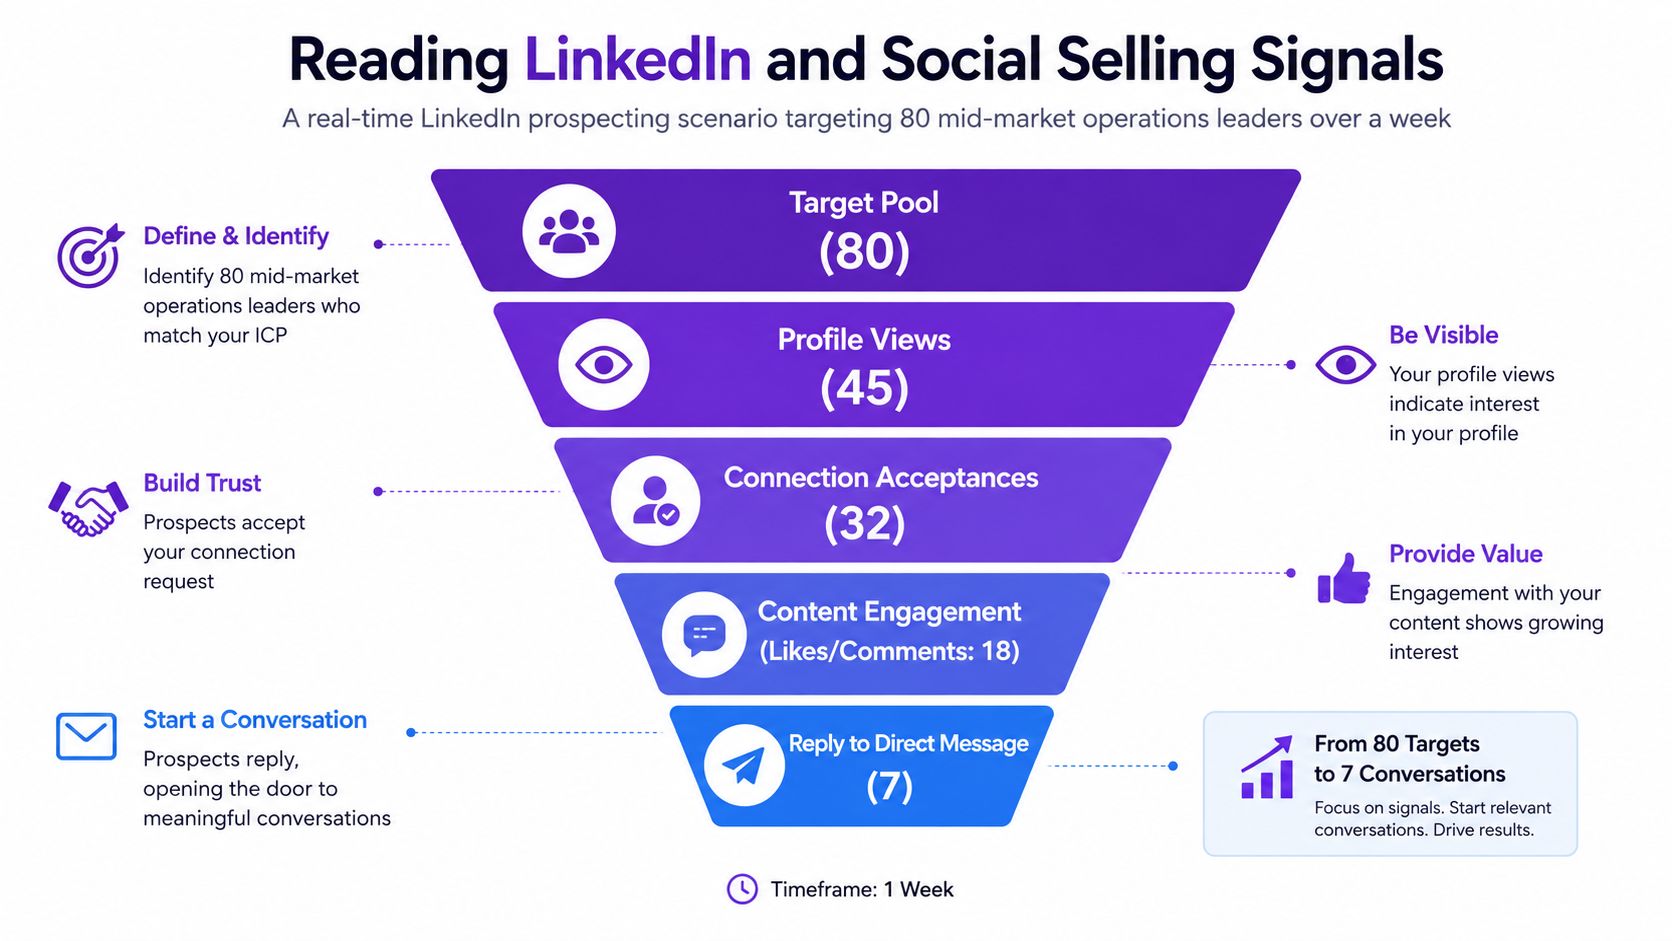
The scoring model should distinguish passive attention from active intent. Independent LinkedIn buying-signal guidance ranks repeated engagement from the same person over several weeks above a single like, while The Sales Playbook's buying-signal guide identifies repeated engagement as stronger than isolated interaction.
A second useful filter is operational:
Recency: Prioritize activity within the last 7 days.
Topic: Give more weight to pricing, product, integration, or case-study content.
Effort: Give more weight to questions in comments, event registration, or two or more Smart Link opens.
These filters come from PhantomBuster's LinkedIn intent guide. A profile view can feed account engagement. A comment on bottom-of-funnel content can raise the contact's score. A direct-message reply should move the account toward buying-group engagement, especially when multiple stakeholders from the same company interact.
Track this in a Rep Activity Pulse dashboard. Compare reps by replies, reply quality, meetings booked, and stakeholder depth, not just views or connection activity. For outbound planning and LinkedIn workflow context, see this LinkedIn lead generation resource.
A Diagnostic Workflow for Stalling Pipelines
When pipeline coverage drops below 3x or slipped-deal rate spikes, don't respond by buying more leads immediately. Start by locating the broken stage.
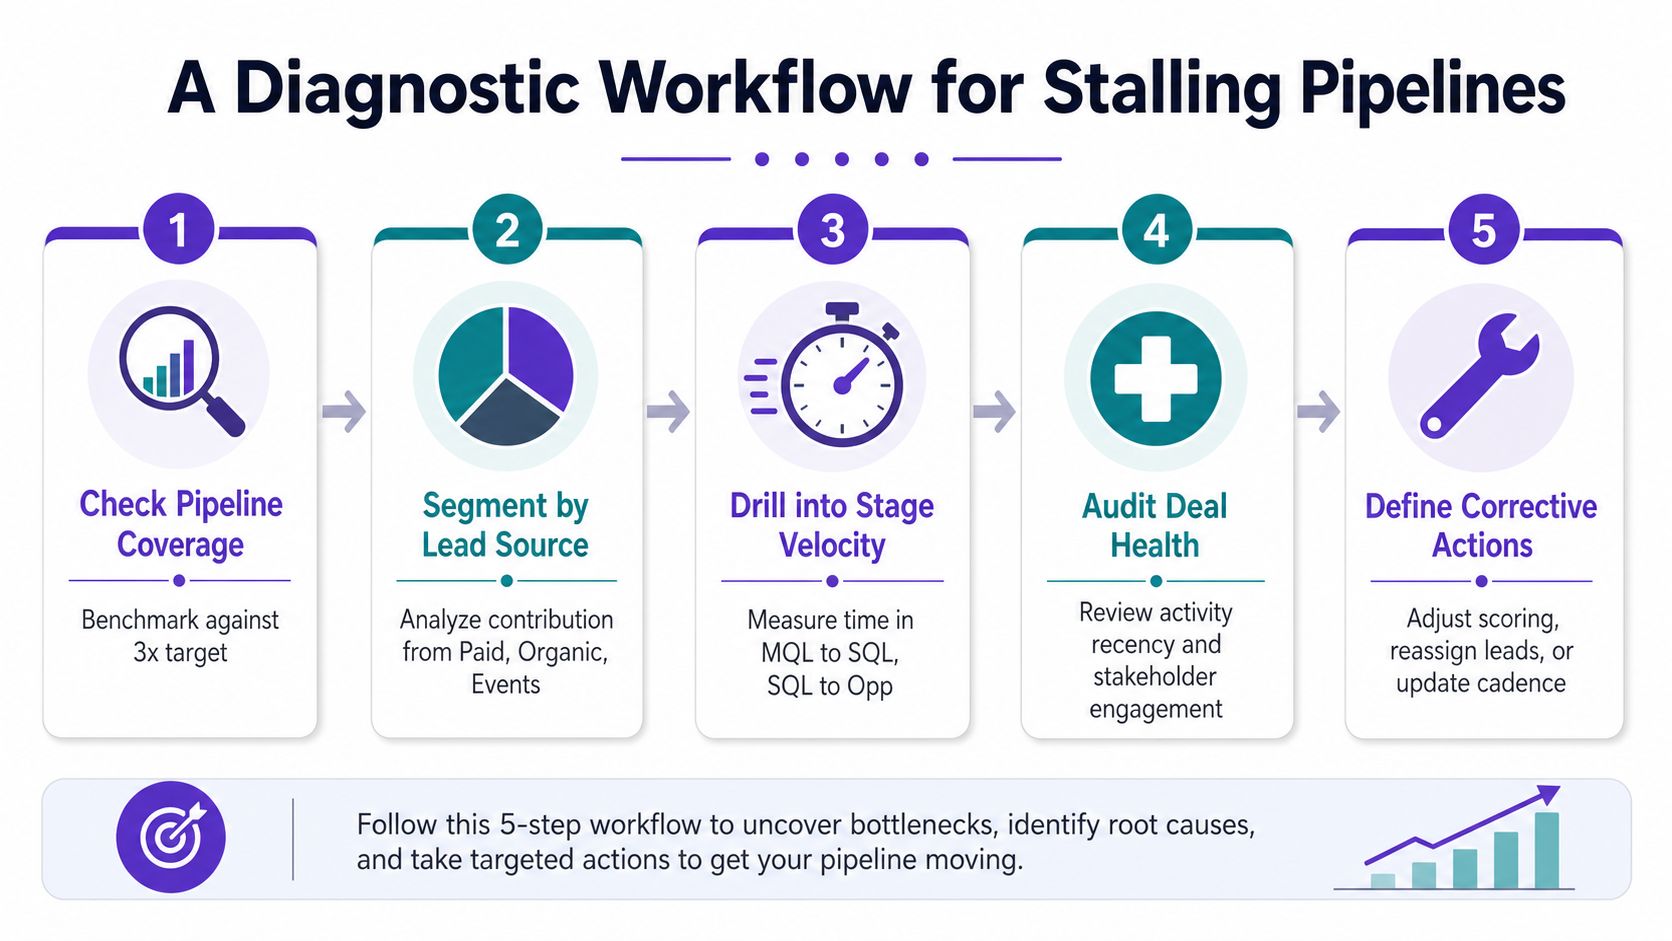
Pair the numbers that explain the leak
Check coverage: Compare current qualified pipeline with the 3x target, then separate committed, upside, and slipped deals.
Segment sources: Break results into paid, organic, events, outbound, and intent-led sources. A blended rate can hide one channel poisoning the average.
Inspect stage velocity: Review time and conversion through MQL-to-SQL and SQL-to-opportunity. The source benchmark notes that MQL-to-SQL can be under 10% in underperforming programs, while healthy programs often sit at 13% to 25%. See Tomba's benchmark discussion.
Audit deal health: Check recent activity, next steps, stakeholder participation, and whether the original business problem still exists.
Assign one corrective action: Change scoring, reroute leads, revise the cadence, or remove a weak source. Don't launch five fixes and then claim victory when one happened to work.
Use metric pairs to attribute the problem. Low MQL volume paired with stable MQL-to-SQL suggests a demand issue. High MQL volume paired with weak MQL-to-SQL points toward targeting, scoring, or handoff quality. Strong SQL creation with weak opportunity progression shifts attention to sales qualification and discovery.
Within 72 hours, identify the stuck stage, pull the relevant source slice, review a sample of deals with the AE and SDR, and assign one owner to test one fix the following week. A triage meeting that produces twelve action items has produced a group discussion, not a diagnosis.
Putting the Stack to Work This Quarter
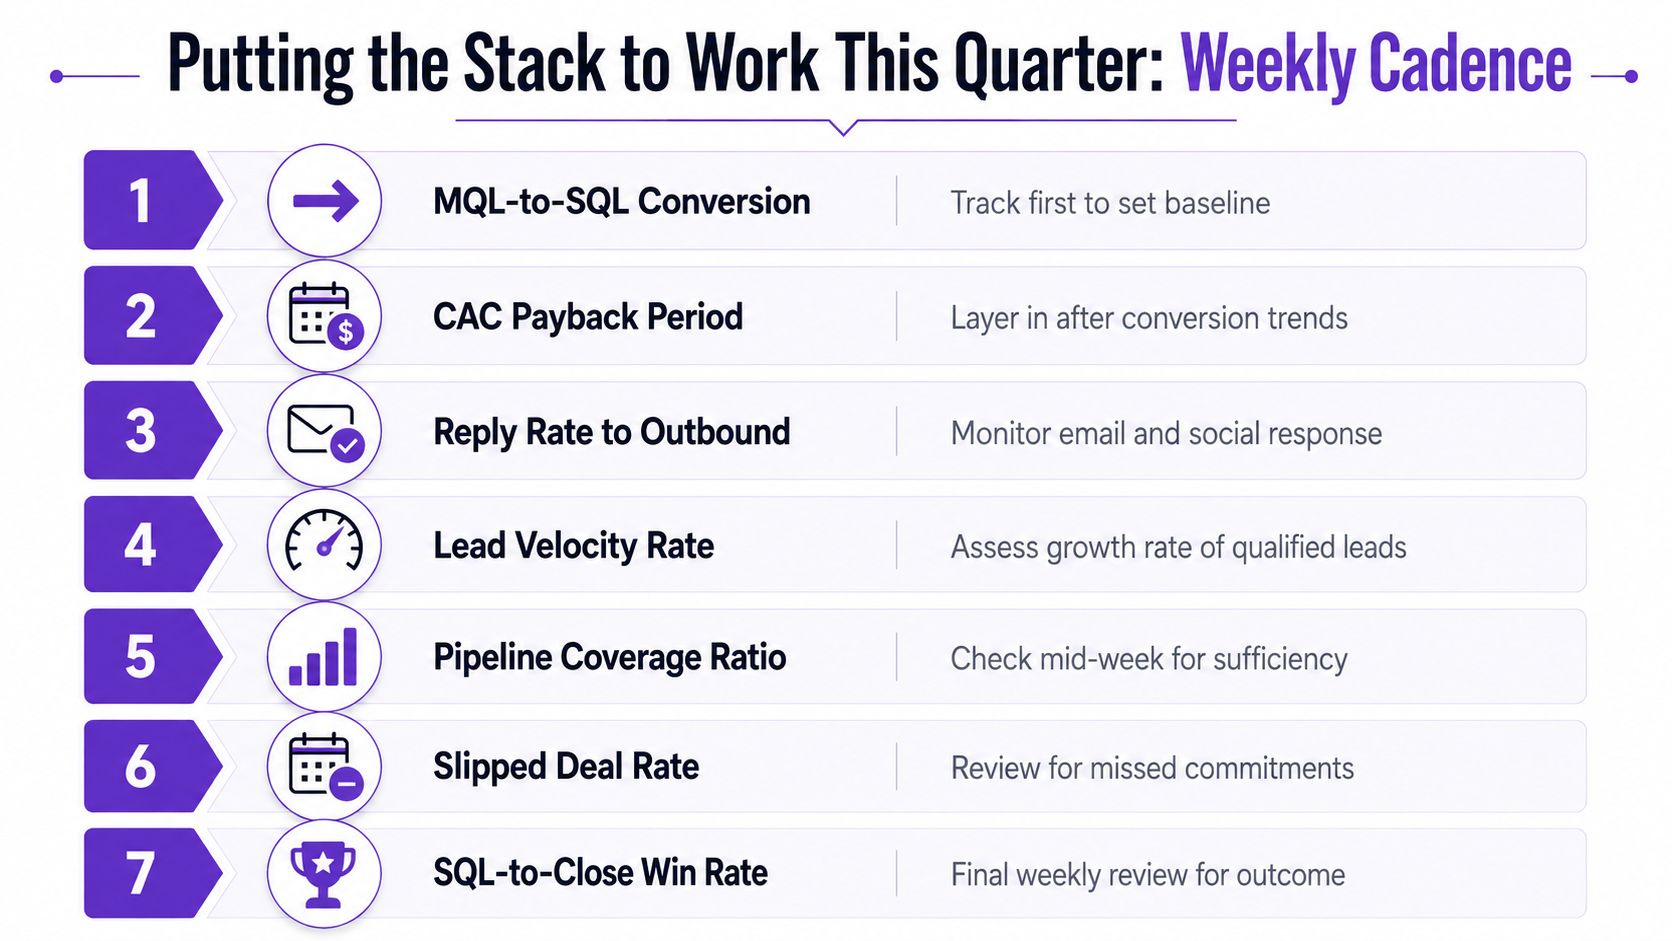
A weekly operating rhythm should sequence metrics instead of displaying everything at once. Start with MQL-to-SQL conversion, add CAC payback to expose cash pressure, then review reply rate and qualified-lead velocity against the prior 90 days. Finish with pipeline coverage, slipped deals, and SQL-to-close outcomes.
Assign one owner to each metric and set a 30-day movement target. Review the deltas in a 20-minute pipeline standup, with one rule: every unfavorable change must connect to a specific operational lever. A falling reply rate may require message or audience work. A slowing velocity may require routing or stage redesign. Weak buying-group depth may require multi-threaded account research.
Intent-led prospecting compounds across the stack because better source quality can improve qualification, response relevance, and sales efficiency at the same time. The key is to measure the behavior that precedes a meeting, not to award points for every digital twitch.
RoverLead AI is one option for surfacing LinkedIn buying-group depth and reply-intent signals, then feeding higher-quality accounts into scoring and prospecting workflows. That supports a shift away from raw lead volume and toward pipeline velocity, meeting yield, and closed-won outcomes.
If your dashboard still treats every lead as equally valuable, RoverLead AI can help identify active LinkedIn engagement and turn relevant buying signals into prioritized prospecting opportunities. Visit the platform, define your ICP and intent criteria, and use the resulting signal feed to improve reply quality, buying-group depth, and pipeline velocity this quarter.
Frequently Asked Questions About Lead Generation Metrics
What are the most important lead generation metrics?
Start with MQL-to-SQL conversion, SQL-to-opportunity rate, pipeline velocity, CAC payback, and reply rate. Lead volume matters for capacity planning, but it shouldn't be the primary success measure.
How do you calculate MQL-to-SQL conversion?
Divide the number of sales-qualified leads by the number of marketing-qualified leads, then multiply by 100. Keep the time period and lifecycle definitions consistent.
What is a good MQL-to-SQL conversion rate?
The cited B2B SaaS benchmark is 13%, while healthy programs in the provided benchmark set often fall between 13% and 25%. Compare like-for-like segments before judging performance.
Why is lead volume a weak success metric?
Volume doesn't show whether leads match the ICP, receive timely follow-up, or progress to opportunities. A smaller source can create more pipeline than a larger source if its intent and qualification quality are stronger.
How do you calculate pipeline velocity?
Multiply the number of opportunities by average deal size and win rate, then divide by sales-cycle length in days. Track it by source and segment so a large blended figure doesn't conceal slow cohorts.
What does CAC payback measure?
CAC payback measures how long it takes gross-profit contribution from a new customer to recover the acquisition cost. It adds a cash-flow view that LTV-to-CAC alone can't provide.
What is a useful reply-rate benchmark?
One independent 2026 roundup reports 1% to 3% average B2B reply rates, 5% to 8% for top-quartile teams, and above 10% for top-decile teams. Treat reply quality and meeting yield as essential companions to the percentage.
Which LinkedIn signals show buying intent?
Repeated engagement from the same person over several weeks is stronger than a single like. Recent activity, bottom-of-funnel topics, questions in comments, event registrations, and multiple Smart Link opens provide more useful qualification context.
How fast should sales respond to an inbound lead?
The supplied benchmark summaries identify under 5 minutes as strong performance and over 1 hour as underperforming. Measure response time separately for forms, demo requests, and other high-intent events.
What should a RevOps team do when pipeline stalls?
Check coverage, segment by source, inspect stage conversion and velocity, review deal health, and assign one owner to test one fix. A focused 72-hour triage is more useful than increasing spend without identifying the leak.