
Revenue Attribution Models: Drive ROI & Growth in 2026

The marketing attribution software market hit $4.74 billion in 2024 and is projected to reach $10.10 billion by 2030, growing at a CAGR of 13.6%, according to Envive's revenue attribution statistics roundup. That figure tells you something useful. Revenue attribution isn't a nice-to-have dashboard anymore. It's a budget defense system.
Sales leaders feel this pressure first. Marketing says paid search influenced the deal. SDRs say the cold outreach opened the door. RevOps points to CRM stage progression. Finance asks the only question that matters: which activities produced revenue?
That gets messy fast in B2B. Buyers bounce between ads, webinars, emails, LinkedIn conversations, demos, and internal approvals. If your team still credits one touchpoint for the whole win, you're not measuring reality. You're picking favorites. And favorites make terrible forecasting tools.
Table of Contents
Introduction to Revenue Attribution Models
If your team closes a deal after a prospect clicks an ad, joins a webinar, replies to an SDR, and takes a demo, who gets credit?
That question sounds political, but it's really financial. Revenue attribution models are the rules you use to assign revenue credit across the buyer journey. Done well, they tell you which channels deserve more budget, which programs are overpraised, and where sales and marketing are working together.
The problem is that many internal groups still look at isolated metrics. A campaign gets applause for lead volume. An outbound rep gets praise for booking the meeting. Finance sees booked revenue and wonders how any of it connects. That's how companies end up arguing over performance while staring at three dashboards that all claim victory.
If you want cleaner answers, start by separating revenue from softer metrics. The distinction matters in budgeting conversations, especially if your leadership team still mixes up topline activity and actual business outcomes. This breakdown of revenue vs profit vs income is a useful reset before you build any attribution model.
Understanding Revenue Attribution Models
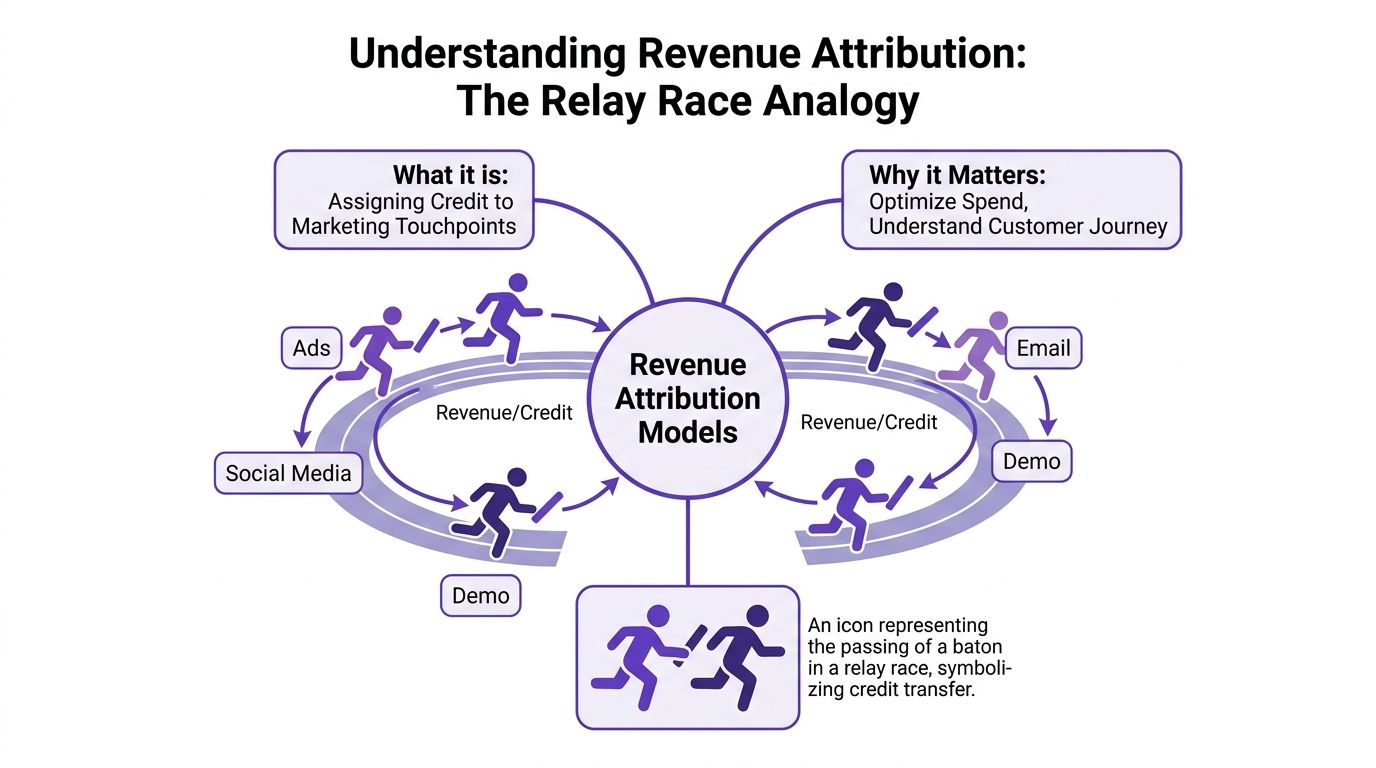
A revenue attribution model is a method for assigning credit for closed revenue to the touchpoints that influenced the deal. Picture a relay race. One runner starts, another advances the position, another keeps momentum, and one crosses the line. Revenue is the baton. Attribution decides how much credit each runner gets.
Why attribution feels harder than it should
A lot of confusion comes from one false assumption. Teams assume a buyer journey behaves like a neat funnel. It usually doesn't. A prospect might first see your brand on LinkedIn, visit your website later from direct traffic, respond to outbound after recognizing your company name, and convert after a pricing conversation.
That's why attribution debates drag on. The “first touch” crowd wants credit for demand creation. The “last touch” crowd wants credit for conversion. Both are telling part of the truth, which is another way of saying neither answer is enough on its own.
Practical rule: If your attribution model regularly makes one department look brilliant and everyone else look invisible, the model is probably too simple.
The three big families
Most revenue attribution models fall into three buckets:
Single-touch models assign all credit to one interaction. Usually the first touch or the last touch.
Multi-touch models spread credit across several interactions using preset rules.
Data-driven models use machine learning to evaluate patterns across conversion paths. As Fullcast explains in its revenue attribution model guide, data-driven attribution assigns credit by analyzing thousands of conversion paths rather than applying a fixed formula.
That last category sounds glamorous, and software vendors love to put it on a pedestal. Fair enough. But the best model isn't the fanciest one. It's the one your team can feed with complete, consistent data and explain to leadership without needing a decoder ring.
Common Revenue Attribution Types
Organizations often encounter the same set of models. The trick is understanding what each one assumes about how deals happen.

Single-touch models
First-touch attribution gives all credit to the first known interaction. If a buyer first discovered you through paid social, paid social gets the whole trophy.
Last-touch attribution gives all credit to the final interaction before conversion. If the deal closed after a demo request from branded search, branded search gets all the applause.
These models are easy to implement and easy to explain. They're also blunt instruments. Useful for directional reporting, yes. Reliable for complex B2B buying journeys, not really.
To get a quick visual of the basic taxonomy, this short video does a decent job of summarizing the model families.
Multi-touch rule-based models
Linear attribution splits credit evenly across all recorded touchpoints. If a journey had four interactions, each gets the same share.
Time-decay attribution gives more weight to touches closer to the conversion event. It's popular with teams that believe recency matters most.
U-shaped attribution emphasizes the bookends of the journey. In the U-shaped model, the first touchpoint and the last touchpoint each receive 40% of the credit, while the remaining 20% is split across middle interactions, as outlined by Smarte's explanation of revenue attribution models.
W-shaped attribution goes a step further for B2B. It recognizes three critical milestones: first touch, lead creation, and opportunity creation, then spreads the remaining credit across the middle.
Data-driven models
Data-driven attribution adapts to your actual customer behavior instead of following a preset rule. In theory, that gives you a more realistic picture. In practice, it only works when your website analytics, CRM, and revenue systems agree on what happened and who did it.
A smart model with broken data is still a broken model. It just fails in a more sophisticated-looking way.
Comparing Model Pros and Cons
Choosing among revenue attribution models isn't about finding the universally “best” approach. It's about choosing the model that fits your sales cycle, your data quality, and your team's ability to act on the output.
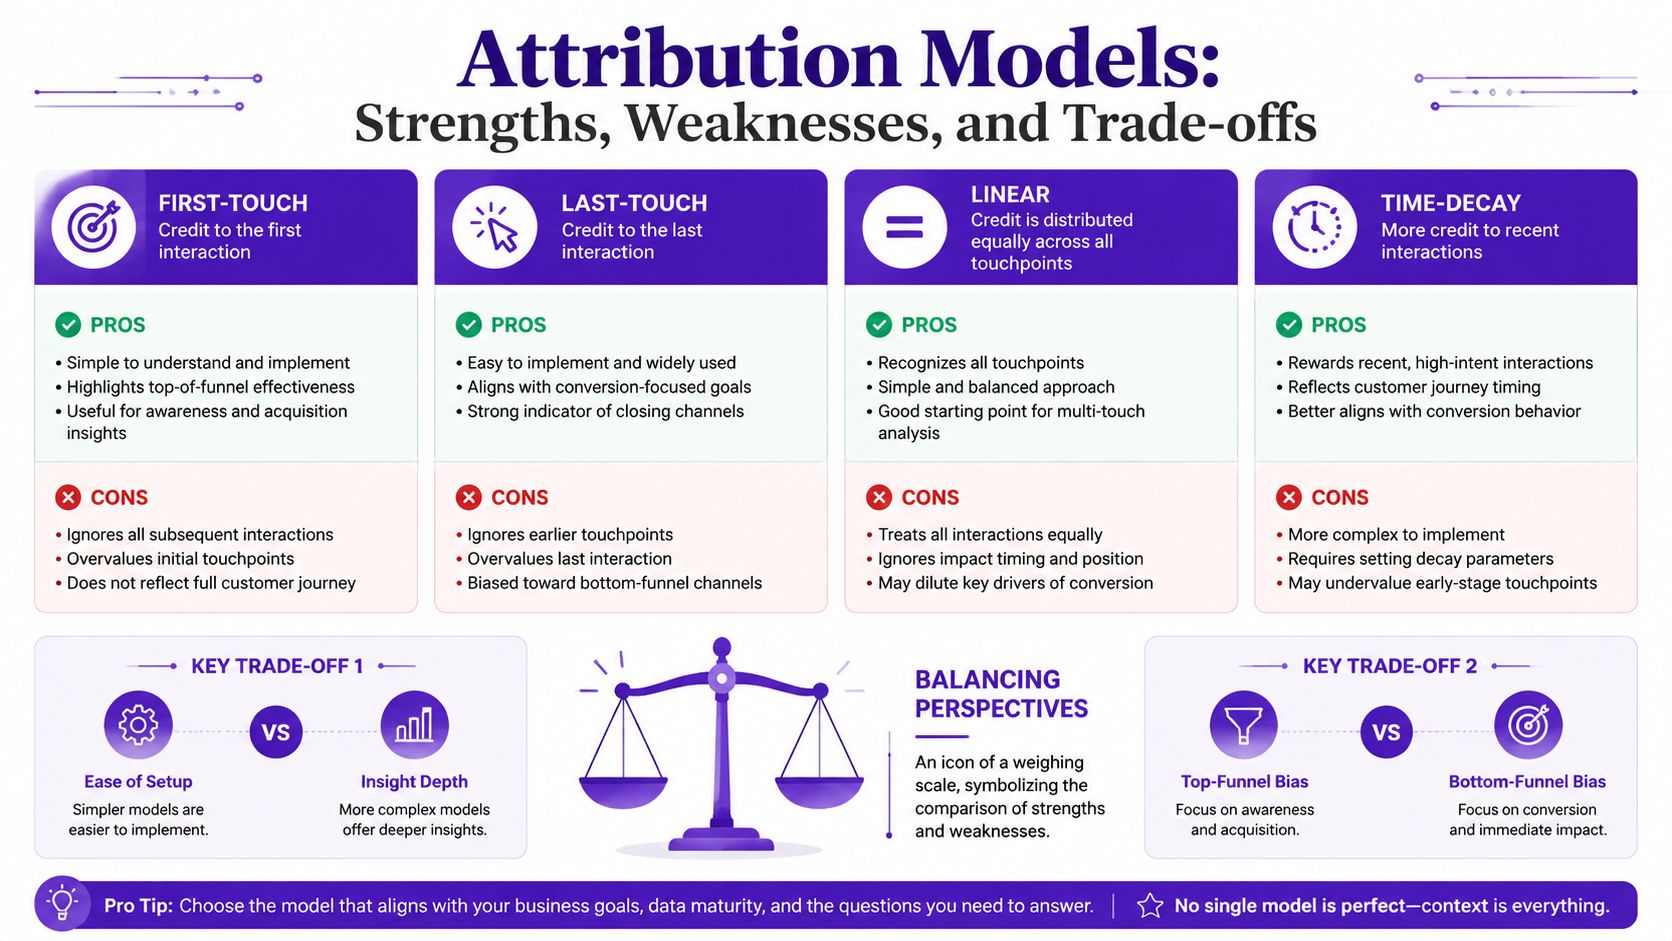
Attribution Model Comparison
Model | Strengths | Weaknesses |
|---|---|---|
First-touch | Simple, useful for awareness analysis | Ignores everything after discovery |
Last-touch | Easy to track, useful for conversion reporting | Overweights closing-stage activity |
Linear | Fair across touchpoints, easy to explain | Treats every interaction as equally important |
Time-decay | Reflects momentum near close | Can undervalue early demand creation |
U-shaped | Balances acquisition and conversion moments | Middle touches often get under-credited |
W-shaped | Better fit for B2B stage-based journeys | Requires reliable CRM stage data |
Data-driven | Tailored to real patterns in your data | Heavy data requirements, harder to audit |
A practical selection rule
For B2B teams with sales cycles longer than 30 days, best practice is to use weighted multi-touch models like the W-shaped (30/30/30/10) model rather than isolating one interaction, according to Prospeo's guide to revenue attribution. In that model, 30% of revenue credit goes to first touch, 30% to lead creation, 30% to opportunity creation, and 10% to the remaining middle-funnel interactions.
That's useful because long B2B deals usually have identifiable milestones. Someone discovers you. Someone converts into a lead. Someone creates a qualified opportunity. Those aren't interchangeable moments.
Use a simpler frame if your team is still early:
Pick first-touch when leadership mainly wants to know what creates awareness.
Use last-touch when your process is basic and you need a clean starting point.
Choose linear if stakeholder politics are intense and you need neutral ground.
Choose W-shaped if your CRM stages are dependable and your sales cycle has real milestones.
Try data-driven only when your systems are integrated and your team can validate the outputs.
Sample Calculations and Data Flow Examples
Theory is nice. Finance still wants math.
Attribution Model Comparison Table
Model | Credit Allocation | Best Use Case |
|---|---|---|
First-touch | All credit to the first interaction | Early channel discovery |
Last-touch | All credit to the final interaction | Conversion-focused reporting |
Linear | Equal credit across all touches | Balanced view of long journeys |
U-shaped | 40% first, 40% last, 20% middle | Journeys where start and finish matter most |
W-shaped | 30% first, 30% lead creation, 30% opportunity creation, 10% middle | B2B deals with clear lifecycle stages |
Say a deal includes these touches: LinkedIn ad, webinar signup, SDR email reply, demo, closed-won invoice.
Under linear attribution, each recorded touch gets an equal slice of the revenue. Under U-shaped attribution, the LinkedIn ad and the demo would receive the largest shares, while the webinar and SDR reply would split the remainder. Under W-shaped attribution, you'd map the interactions to milestone events and assign the weight accordingly.
How the data actually moves
The model only works if the data path is intact:
Marketing systems capture the touch. UTM-tagged links, campaign clicks, webinar registrations, and page visits start the trail.
The CRM records the lifecycle change. Lead creation, opportunity creation, and stage updates connect activity to pipeline.
The billing platform confirms revenue. Closed-won data turns “influence” into actual booked dollars.
To deploy a functional multi-touch model in B2B, organizations need four minimum data conditions: 500–1,000 closed deals with touchpoint history, 18–24 months of channel-specific spend data, clean CRM opportunity stages with revenue values, and account-level identity resolution, according to LeadSources' B2B revenue attribution glossary.
If one of those layers is weak, your calculation won't just be incomplete. It will be confidently wrong, which is much more dangerous.
Implementation Checklist and Key KPIs
A reliable attribution rollout is less about software setup and more about operational discipline. Teams get into trouble when they install a tool before agreeing on naming conventions, ownership, and revenue definitions.
Deployment checklist
Start with the basics:
Audit UTM hygiene: Make sure campaigns use consistent source, medium, and campaign naming.
Sync analytics and CRM: Website visits should map cleanly to lead and opportunity records.
Create lifecycle source fields: Track origin at first touch, lead conversion, opportunity creation, and closed-won.
Pull billing data into the model: Revenue should come from the system of record, not from hopeful spreadsheet math.
Resolve identities at the account level: Especially in B2B, multiple contacts often influence one deal.
Define ownership rules: Decide who owns corrections when campaign data or CRM fields are wrong.
If your current stack feels fragmented, it helps to think of attribution as one layer of a broader customer systems problem. This overview of what a customer engagement platform is gives a useful lens for understanding why disconnected tools create reporting friction.
Good attribution usually starts with boring consistency. Clean field names beat clever dashboards every time.
KPIs worth watching
After launch, don't drown the team in vanity metrics. Track the handful that indicate whether the model is useful:
Attributed revenue ratio: How much booked revenue is connected to known touchpoints.
Channel ROI by attribution view: Which channels look stronger under your chosen model.
Average deal size by channel path: Helpful for spotting whether some channels produce bigger opportunities.
Model confidence score: Your internal assessment of data completeness and trustworthiness.
Budget shift outcomes: What happened after you moved spend based on attribution findings.
The key is consistency. Use these KPIs over time. Don't switch definitions mid-quarter because one channel manager had a rough month.
Pitfalls and Validation Tests
Attribution projects usually fail for ordinary reasons, not exotic ones.
The traps that wreck trust
Missing UTM parameters. Duplicate CRM records. Lifecycle stages that sales reps interpret differently. Revenue fields that don't match finance. Then there's the classic mistake: an algorithmic model trained on thin data that produces elegant nonsense.
For teams without a dedicated data science unit, or teams generating fewer than 10,000 conversions per quarter, rule-based models plus self-reported validation outperform under-fed algorithmic models, as noted in the earlier Prospeo guidance.
Data quality work is paramount. If your CRM is cluttered, CRM data enrichment becomes more than a hygiene project. It becomes a prerequisite for credible attribution.
How to validate before you reallocate budget
Validation should happen fast. Best practice is to test the chosen model's accuracy within 90 days using geo-tests or holdout groups, comparing attributed lift against actual lift, according to the same Prospeo guidance referenced earlier.
Use practical checks like these:
Geo-based holdouts: Reduce or pause activity in one region while keeping another steady.
Time-based control groups: Compare periods with and without a specific channel or program.
Channel toggle tests: Pause a tactic briefly and observe what changes downstream.
If attributed lift and observed lift don't line up, don't argue with reality. Recalibrate the model.
Attributing Revenue in LinkedIn Social Selling
LinkedIn creates a special attribution mess. In many outbound or hybrid GTM motions, the first meaningful touch isn't a marketing click. It's a rep's cold message, connection request, comment interaction, or direct conversation.
Why LinkedIn breaks standard attribution logic
Most attribution setups assume the journey starts with marketing. That misses sales-initiated deals entirely. A better fix is to create a dedicated sales-sourced category for outbound and then track whether those deals also encountered marketing touches along the way.
That distinction matters most in social selling. A prospect might reply to an SDR because they've already seen your executives posting, engaged with industry content, or recognized the company from prior exposure. If you only log the final direct response, marketing disappears from the story.
Landbase's GTM guide notes this exact blind spot and recommends separating sales-sourced deals from marketing-influenced ones while checking how many outbound deals included marketing touchpoints during the journey.
A simple operating model for social selling attribution
For LinkedIn-based selling, use a mini-framework:
Create a source category: Label records as sales-sourced, marketing-sourced, or hybrid.
Log social touches in the CRM: Comments, profile visits, message replies, and content engagement belong in the journey record.
Store intent context: Note topic interest, creator interaction, competitor engagement, and buying-stage clues.
Review influence patterns: Look for common paths where social activity appears before meetings and opportunities.
If your team is building pipeline through relationship-led outreach, this guide to social selling on LinkedIn complements attribution work nicely because it focuses on the behavior patterns standard web analytics often miss.
If your team wants a cleaner way to turn LinkedIn engagement into trackable pipeline, RoverLead AI is built for that job. It helps sales teams spot intent signals from real LinkedIn activity, organize those signals into actionable prospecting workflows, and reach out with better timing and context instead of another generic cold message.
FAQ
1. What are revenue attribution models in plain English
They're systems for deciding which sales and marketing interactions deserve credit for a closed deal. Instead of saying one touchpoint caused everything, they spread or assign credit according to a defined method.
2. Why can't I just use last-touch attribution
You can, and many teams start there. The problem is that last-touch ignores everything that created awareness, nurtured interest, and moved the buyer toward the final step.
3. What's the difference between revenue attribution and lead attribution
Lead attribution focuses on who generated the lead. Revenue attribution follows the journey further and connects touchpoints to actual closed revenue.
4. Is multi-touch always better than single-touch
Not automatically. Multi-touch is more nuanced, but it depends on better data and stronger operational discipline. A simple model with clean data often beats a complex model fed by messy systems.
5. When should B2B teams use W-shaped attribution
It fits best when your sales cycle is longer and your CRM captures meaningful milestones like first touch, lead creation, and opportunity creation.
6. What does account-level attribution mean
It means consolidating multiple people's interactions under one account or opportunity record. That matters in B2B because several stakeholders often influence the same deal.
7. Do algorithmic models replace rule-based models
Sometimes, but not always. They can be powerful when your data is complete and abundant. If not, they often create false precision.
8. What systems need to be connected for attribution to work
At minimum, teams usually need website analytics, a CRM, and a billing or revenue system tied together with consistent identifiers and clean records.
9. How do I attribute outbound revenue from LinkedIn
Create a sales-sourced category, log social touches in the CRM, and separate pure outbound influence from mixed journeys that include marketing interactions.
10. How often should attribution models be reviewed
Regularly. Review after implementation, validate early, and revisit when your sales process, campaign mix, or tracking setup changes. Attribution isn't a set-it-and-forget-it exercise.